Wondering if your team can take on another project or client? This free team capacity calculator shows the answer in seconds. Add your team members with their weekly working hours, account for the percentage of time actually spent on productive work, enter your current committed workload, and the calculator shows available capacity, utilization percentage, and burnout risk instantly. No signup. No email collected. Your data stays in your browser.
📊 Team Capacity Calculator
👥 Your Team
⚙️ Capacity Settings
How to Use This Team Capacity Calculator
Add each team member with their weekly working hours. Most full-time employees work 40 hours, but part-time, contractor, or shared resources may have different totals. Adjust the productive hours percentage to reflect how much of the workday is actually spent on project work versus meetings, admin, and breaks. The default 70% reflects typical knowledge work realities. Finally, enter your current committed hours across all active projects. The calculator instantly shows whether your team has capacity for more work or is approaching burnout.
The capacity bar uses three colors to show status quickly. Green means you have healthy capacity available and can take on more work. Yellow means you are approaching optimal load and should pause before adding major commitments. Red means your team is at or above maximum sustainable capacity, and adding work risks burnout, missed deadlines, or quality drops.
What Is Team Capacity Planning?
Team capacity planning is the process of measuring how much work your team can complete in a given time period based on available hours, productivity, and current commitments. Effective capacity planning prevents two opposite failures: overbooking the team into burnout and missed deadlines, or underbooking and leaving billable hours unused. The math is simple but most teams fail to do it consistently.
According to a 2024 McKinsey workforce productivity study, the average organization operates at 78% of theoretical capacity due to meetings, context-switching, and administrative work. Teams that explicitly track and plan capacity report 24% better on-time delivery rates than teams that allocate work informally.
Why the 70% Productivity Default Matters
A 40-hour workweek does not deliver 40 hours of productive work. Realistic productivity ranges across industries reveal that most knowledge workers achieve 25-30 hours of focused project work per week, with the rest consumed by meetings, communication, administrative tasks, breaks, and context switching.
| Role Type | Typical Productive Time | Why |
|---|---|---|
| Individual contributors (engineers, designers, writers) | 70-75% | Heavy focused work, fewer meetings |
| Agency producers (account managers, project managers) | 60-70% | Higher meeting load with clients |
| Senior managers and directors | 50-60% | Significant management overhead |
| Sales and customer-facing roles | 65-75% | Time blocked for prospect meetings |
| Executives and C-suite | 40-55% | Constant context-switching across functions |
| Operations and support roles | 75-85% | More structured task-based work |
Setting productivity at 100% assumes every working hour is productive project work. This is unrealistic and leads to chronic overcommitment. According to research published in the Harvard Business Review in 2024, teams that planned at 100% theoretical capacity completed only 71% of planned work on time, while teams that planned at 70% capacity completed 94% of planned work on time. The lower planning baseline produces higher actual delivery.
What Utilization Rate Should Your Team Target?
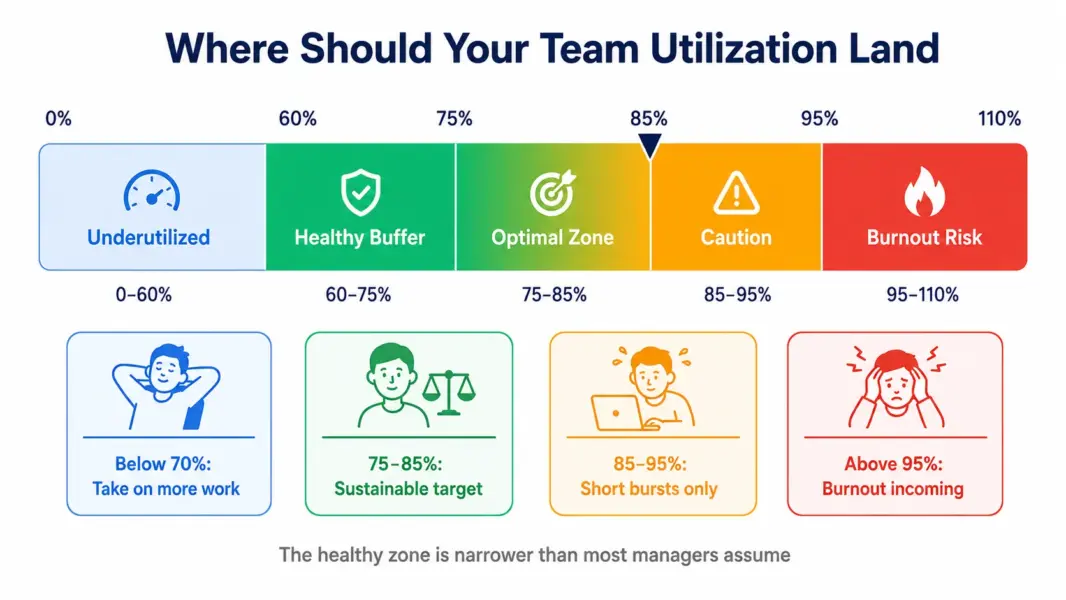
Optimal team utilization depends on the type of work and how much variability you face. Most healthy professional services and product teams target 75-85% utilization. Going higher creates burnout risk. Going lower leaves capacity unused that could deliver value or generate revenue.
| Utilization Rate | What It Means | Recommended Action |
|---|---|---|
| Below 60% | Significant unused capacity | Take on more work, accept new clients, or reduce team size if sustained |
| 60-75% | Healthy capacity with buffer | Sustainable long-term, room for unexpected work and improvement projects |
| 75-85% | Optimal target for most teams | Maximum productivity zone with manageable buffer |
| 85-95% | Approaching capacity limits | Sustainable for short bursts only, monitor for burnout signs |
| Above 95% | Maximum sustainable load | Cannot sustain past 2-3 weeks without breakdowns |
| Above 100% | Overbooked, math does not work | Descope, hire, or push back. Heroics will not close the gap. |
Agency leadership consultant Karl Sakas notes in his agency operations work: “The most common agency mistake is targeting 90%+ utilization. Teams hit it for 2-3 months, then burn out. Smart agencies target 75-80% and absorb variability through buffer, not through overtime.”
How Capacity Planning Connects to Project Management Software
This calculator gives you a snapshot of total team capacity. Sustained capacity planning requires PM software that tracks hours worked, project assignments, and workload across team members continuously. Several PM tools include workload management features that automate the math this calculator does manually.
ClickUp Business ($12 per user) includes a Workload view showing each team member’s hours allocated across projects. Asana Advanced ($24.99 per user) includes a Workload feature with capacity visualization. Wrike Business ($24.80 per user) provides resource management with capacity planning. Teamwork Grow ($25.99 per user) adds workload views for agency capacity planning. Monday.com Pro ($16 per seat) includes Workload as part of its visual platform.
For teams managing capacity manually with spreadsheets and meetings, dedicated PM software with workload features typically saves 4-6 hours per week per project manager according to a 2024 Capterra industry survey. See our best PM tools for small teams or best PM tools for agencies for tools that include workload management.
Compare PM tools with workload features
Use our free PM tool cost calculator to compare exact monthly pricing across every platform with capacity management.
Frequently Asked Questions
How do I calculate team capacity?
Team capacity equals total weekly working hours multiplied by your productivity percentage. For a 5-person team working 40 hours each at 70% productive time, capacity is 5 × 40 × 0.70 = 140 productive hours per week. Subtract currently committed project hours to find available capacity. This calculator does the math automatically for any team size and productivity assumption.
What is a good utilization rate for a team?
Most healthy teams target 75-85% utilization. Below 70% leaves capacity unused that could deliver value or revenue. Above 90% creates burnout risk and missed deadlines. The optimal target varies by role: individual contributors handle higher utilization (80-85%), while managers and executives should stay lower (60-70%) due to context-switching demands.
Why is productivity less than 100%?
Nobody works 100% of their working hours on productive project work. Meetings, communication, administrative tasks, breaks, and context-switching consume 20-50% of typical working time. Setting productivity at 100% leads to chronic overcommitment and missed deadlines. The default 70% reflects realistic knowledge work productivity validated by multiple workforce studies.
How accurate is this team capacity calculator?
The calculator provides accurate math for the inputs you provide. Accuracy depends on realistic productivity assumptions and accurate committed-hours data. For your first capacity planning exercise, use the suggested 70% productivity baseline. After 2-4 weeks of actual time tracking in a PM tool, adjust to match your team’s real productivity rate. Most teams discover their real productivity is 5-15% lower than initially estimated.
When should I add more team capacity?
Add capacity when utilization consistently exceeds 85% for more than 4 consecutive weeks, when you regularly turn down profitable work due to lack of capacity, when team members report burnout or sustained overtime, or when delivery quality degrades despite full effort. According to a 2024 Gallup study, teams operating above 85% utilization for over 6 weeks show 31% higher turnover risk, making delayed hiring more expensive than the salary cost.
Should I include part-time workers in capacity calculations?
Yes. Add part-time workers with their actual weekly hours (20, 25, 30 hours depending on their schedule). The calculator handles different hours per member naturally. Apply the same productivity multiplier across all team members for consistency. Contract workers and consultants follow the same approach using their committed hours per week to your team.
What if my team has different productivity rates per person?
This calculator applies one productivity rate to the whole team for simplicity. For mixed teams with very different roles (developers at 80% and managers at 55%), calculate each group separately or use a weighted average. Most teams find a single team-level productivity rate sufficient for planning purposes, with individual variations averaging out across the team.
How does capacity planning prevent burnout?
Capacity planning prevents burnout by making overcommitment visible before it happens. When you can see that accepting a new project would push utilization above 90%, you can negotiate timelines, decline the work, or add capacity proactively. Teams that plan capacity formally report 24% better on-time delivery and significantly lower burnout rates than teams that allocate work informally without measuring capacity.
Next Steps After Calculating Capacity
If this calculator shows your team has healthy available capacity, the next step is filling it with profitable work or improvement projects. If it shows you are at or above maximum capacity, the next step is one of three actions: descope existing commitments, add team capacity through hiring or contractors, or push back on incoming work until current commitments complete.
For ongoing capacity management beyond one-time calculations, you need project management software that tracks workload continuously. Take our free PM tool picker quiz to find the right PM platform with workload management for your team. Compare exact monthly costs across platforms using our free PM tool cost calculator.
Related Free Tools and Guides
- Free PM Tool Cost Calculator
- PM Tool Picker Quiz
- Best PM Tools for Small Teams
- Best PM Tools for Agencies
- ClickUp Review (includes Workload management)
- Teamwork Review (best for agency capacity planning)
- Complete Guide to Project Management Software